Smoking in Scotland – How Households Have Quit Cigarettes
An analysis of how smoking rates in Scotland have changed between 2012 and 2019
Trends in Smoking Habits Across Scotland (2012–2019)
From 2012 to 2019, the Scottish Survey Core Question (SSCQ)—a project combining several large household surveys (more here)—was used to track smoking rates across Scotland.
The data shows a clear trend: more and more Scots are quitting cigarettes. While we cannot determine causation from this dataset, we can highlight significant differences across age groups and constituencies. These findings reveal how smoking has declined at different rates within the population.
Smoking by Age Group
The following maps visualize changes in smoking rates across all groups, as well as within three age brackets: 18–34, 35–64, and 65+.
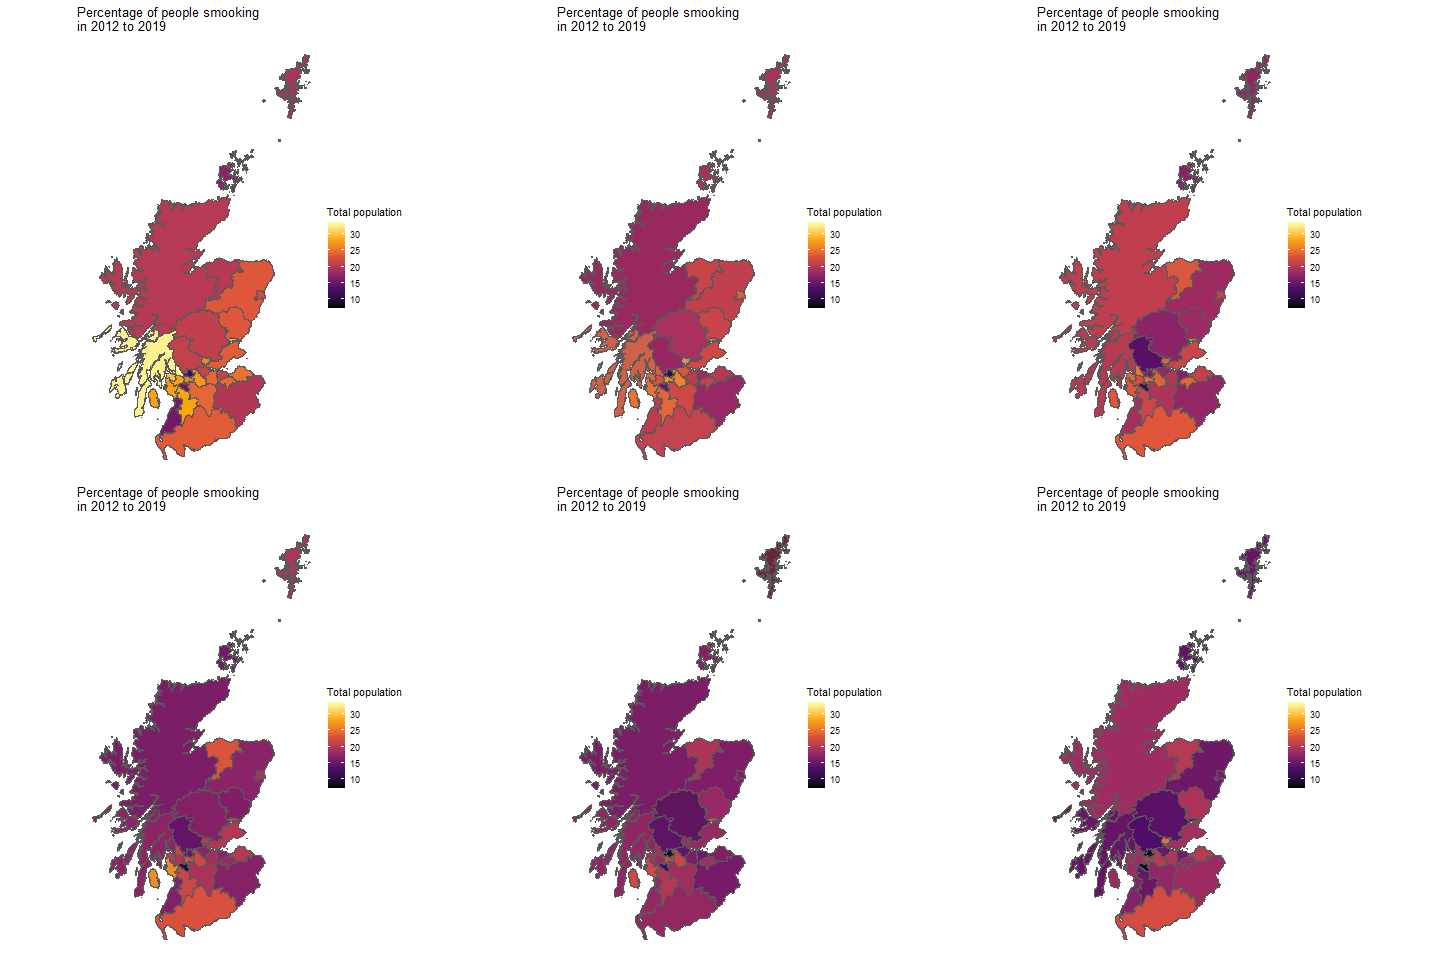
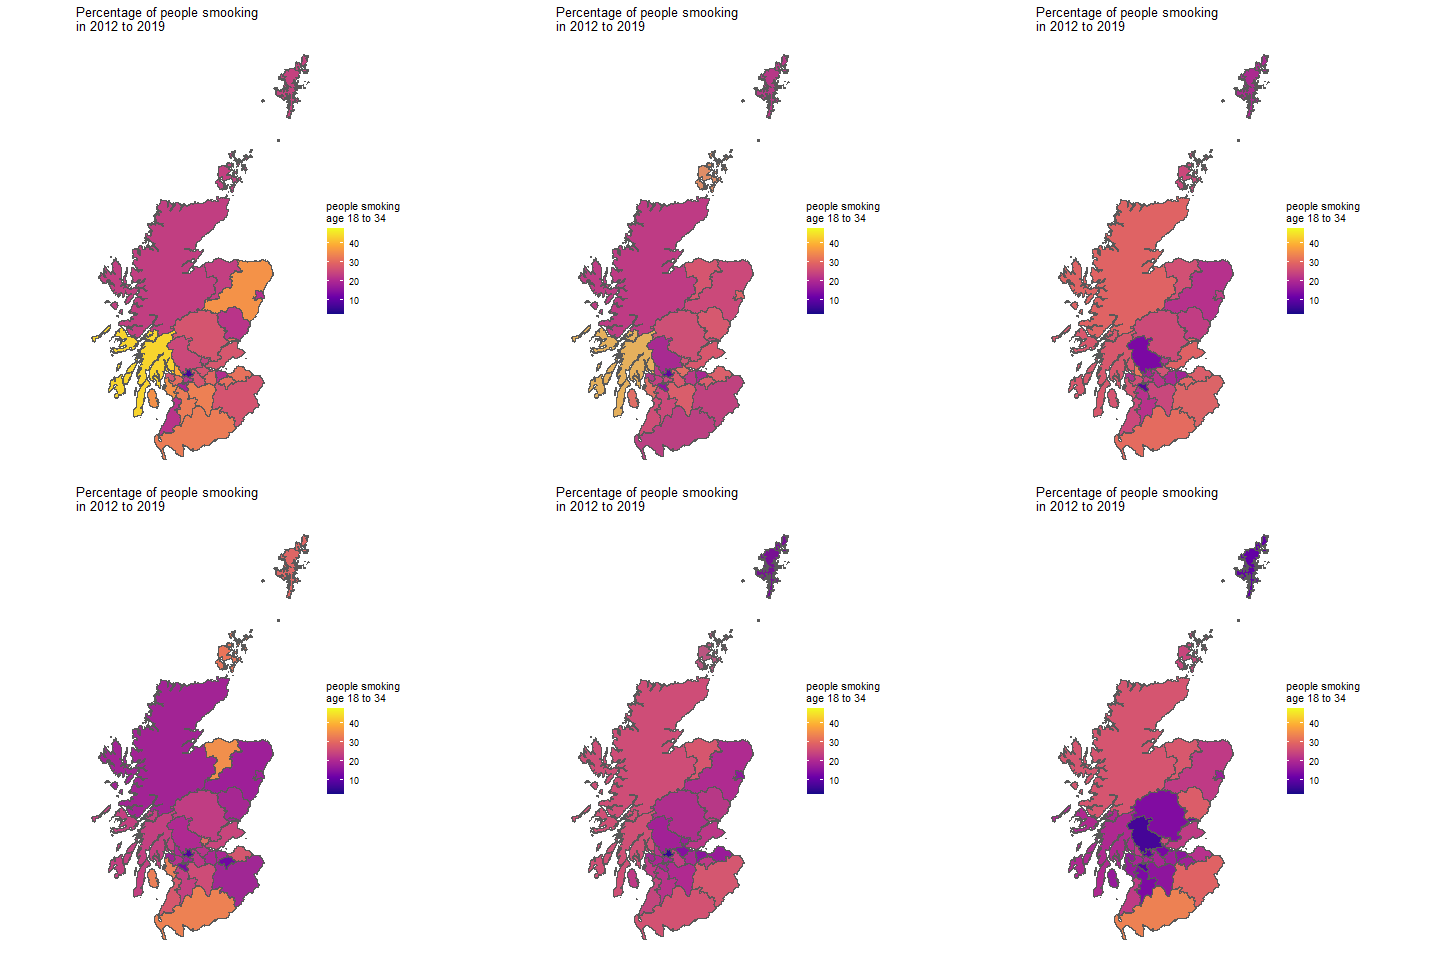
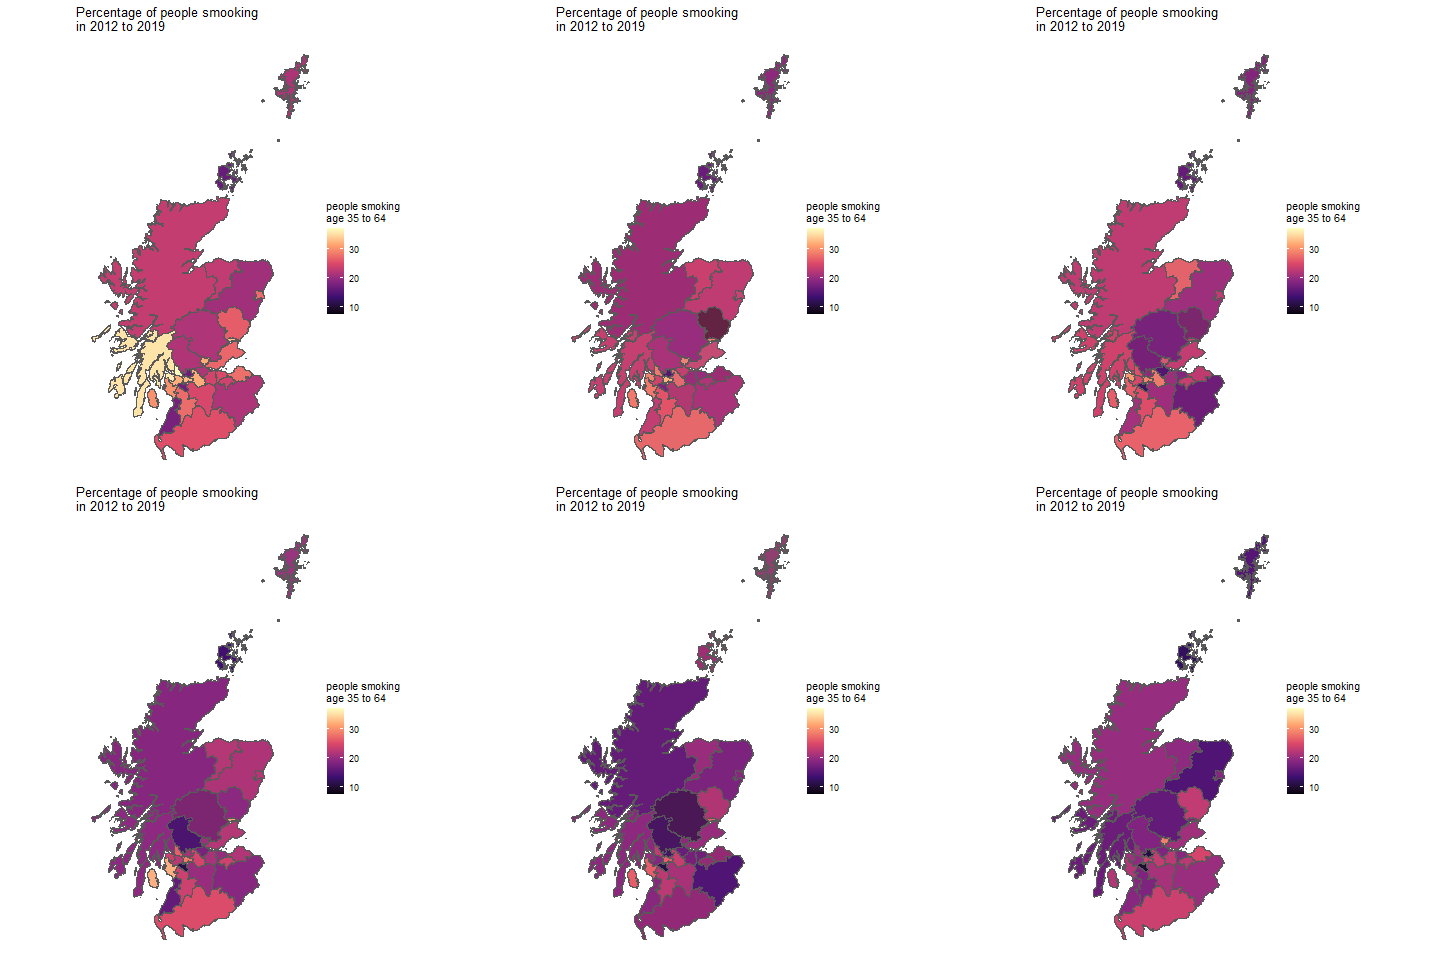
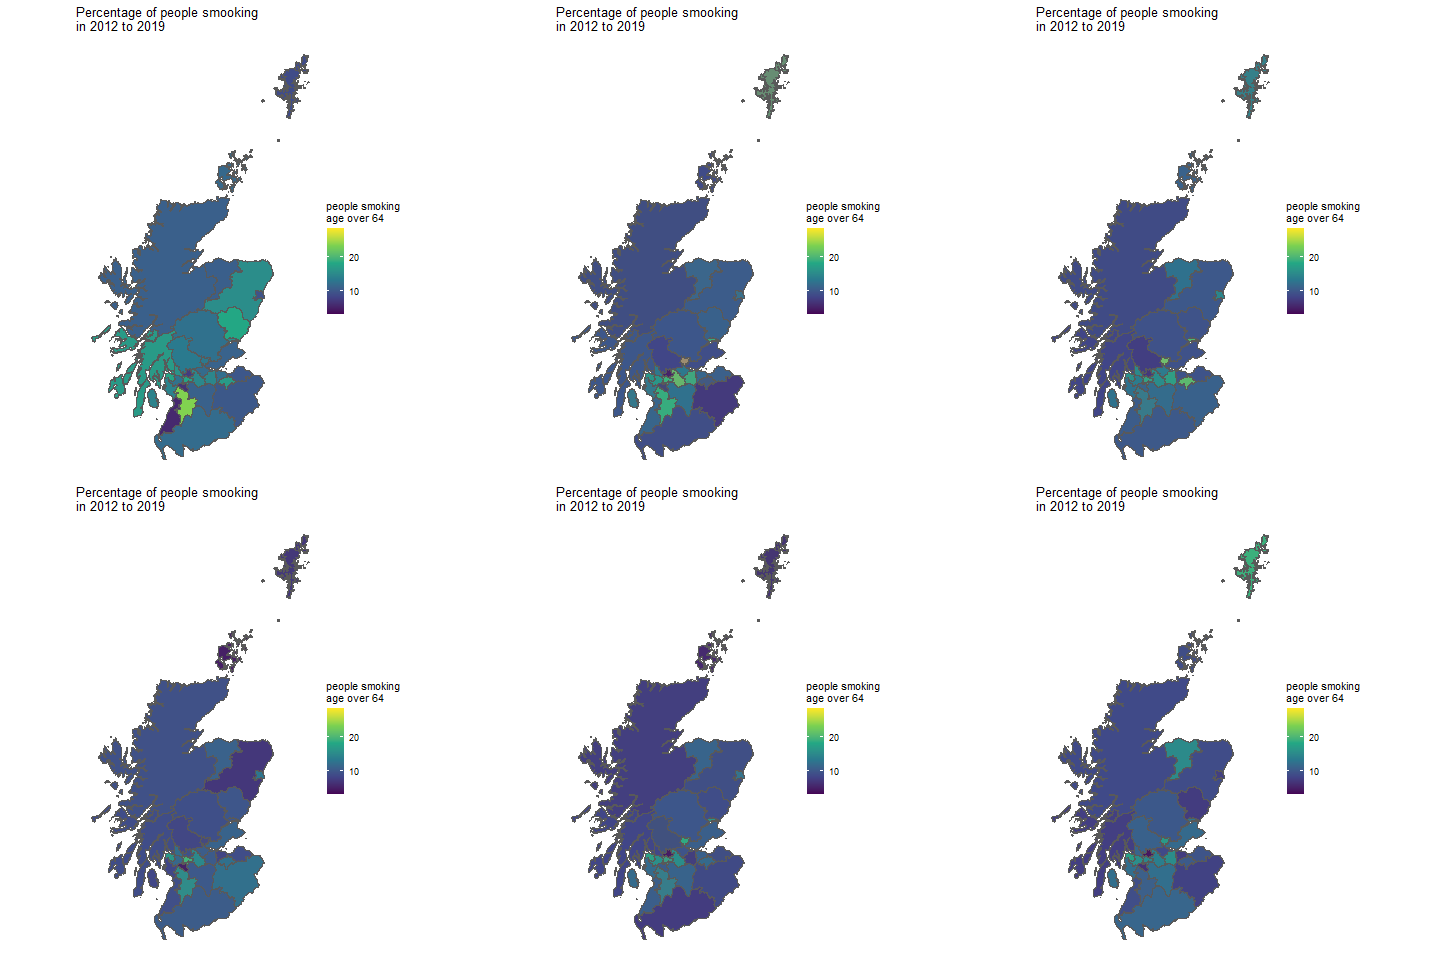
Overall, there is a consistent decrease in smoking across nearly all groups, as further illustrated by the chart below:

One striking observation: older populations (65+) show far less change, with roughly 15% continuing to smoke each year. This highlights the persistence of smoking habits among elderly groups, compared to younger Scots who are quitting at faster rates.
Other Population Groups
Beyond age, we can compare smoking rates among different social groups—such as pensioners, parents, and by gender.
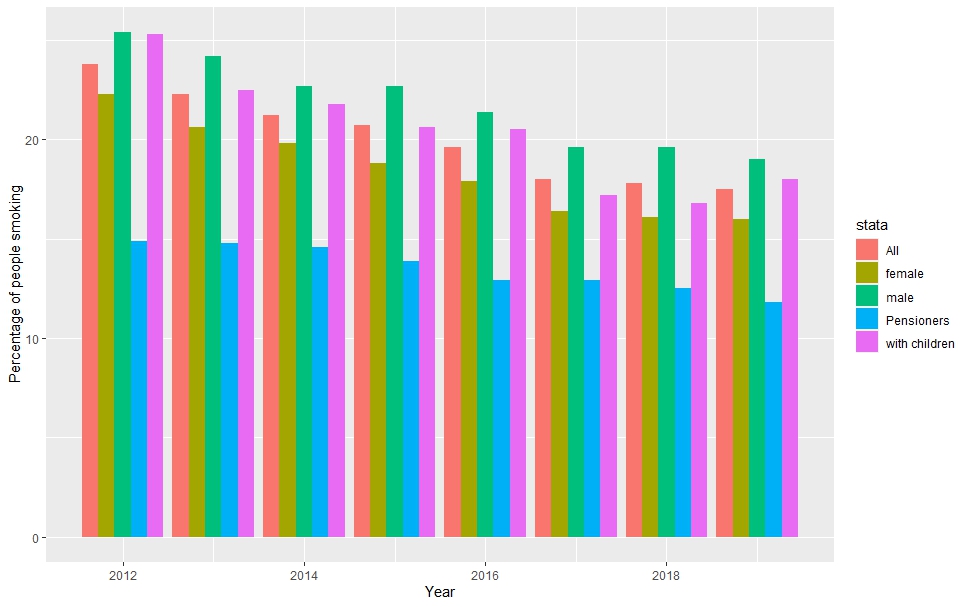
Key findings:
- Men smoke more than the national average.
- Households with children also smoke more than the average.
Male vs. Female Smoking Rates
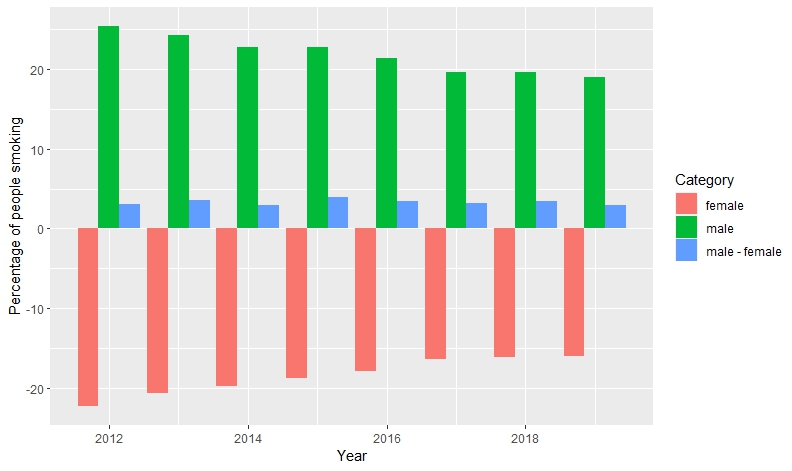

These comparisons confirm that smoking in Scotland is more prevalent among men than women.
Smoking by Constituency
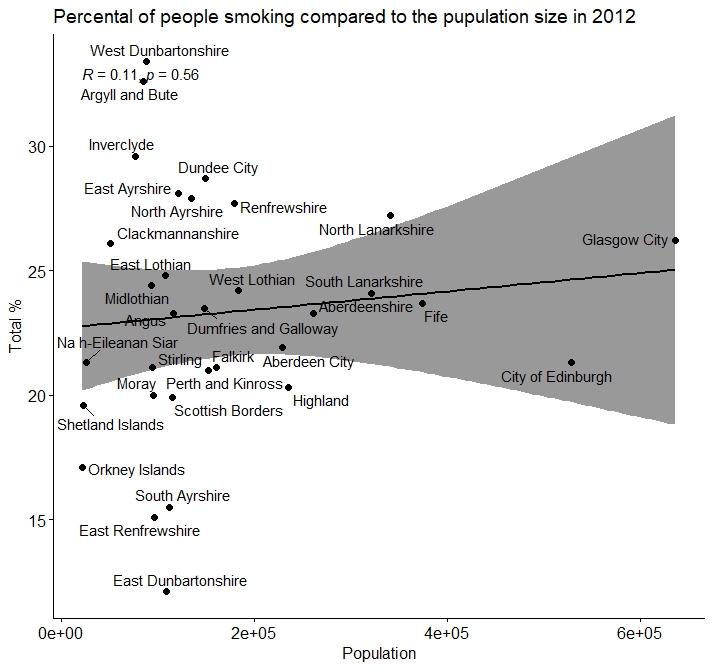
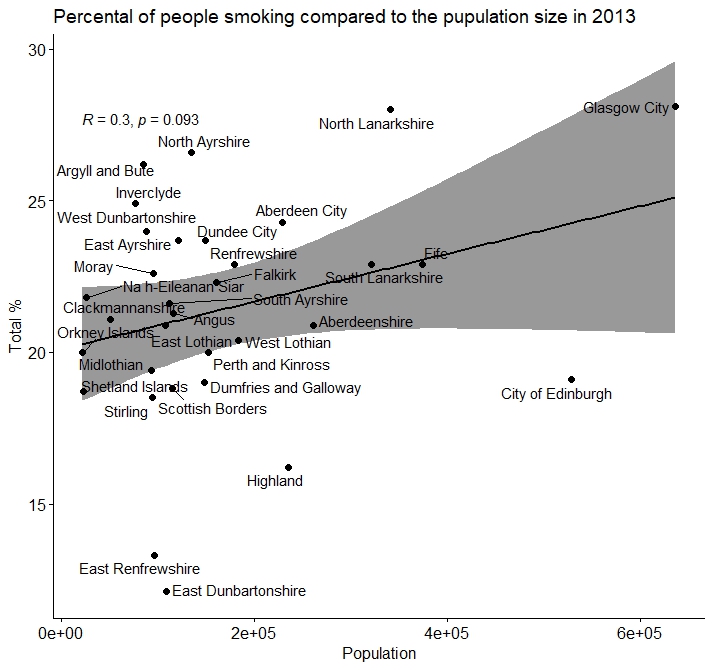
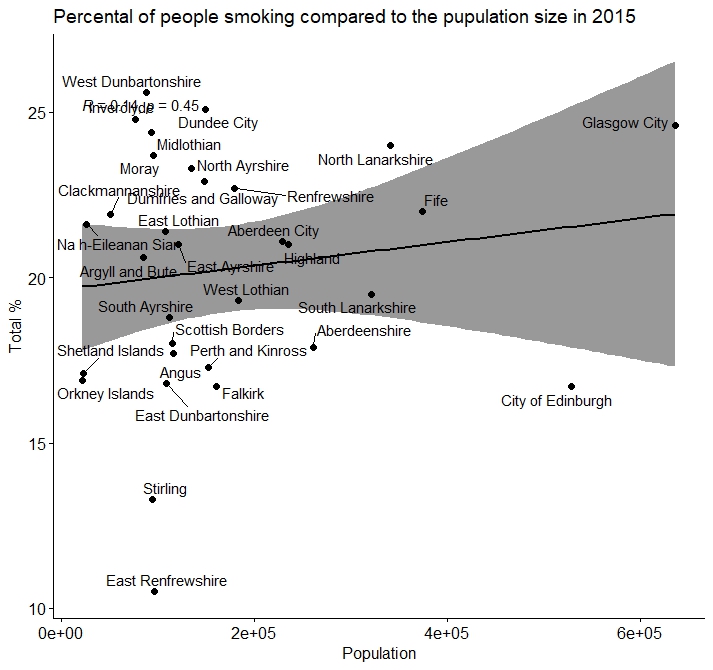
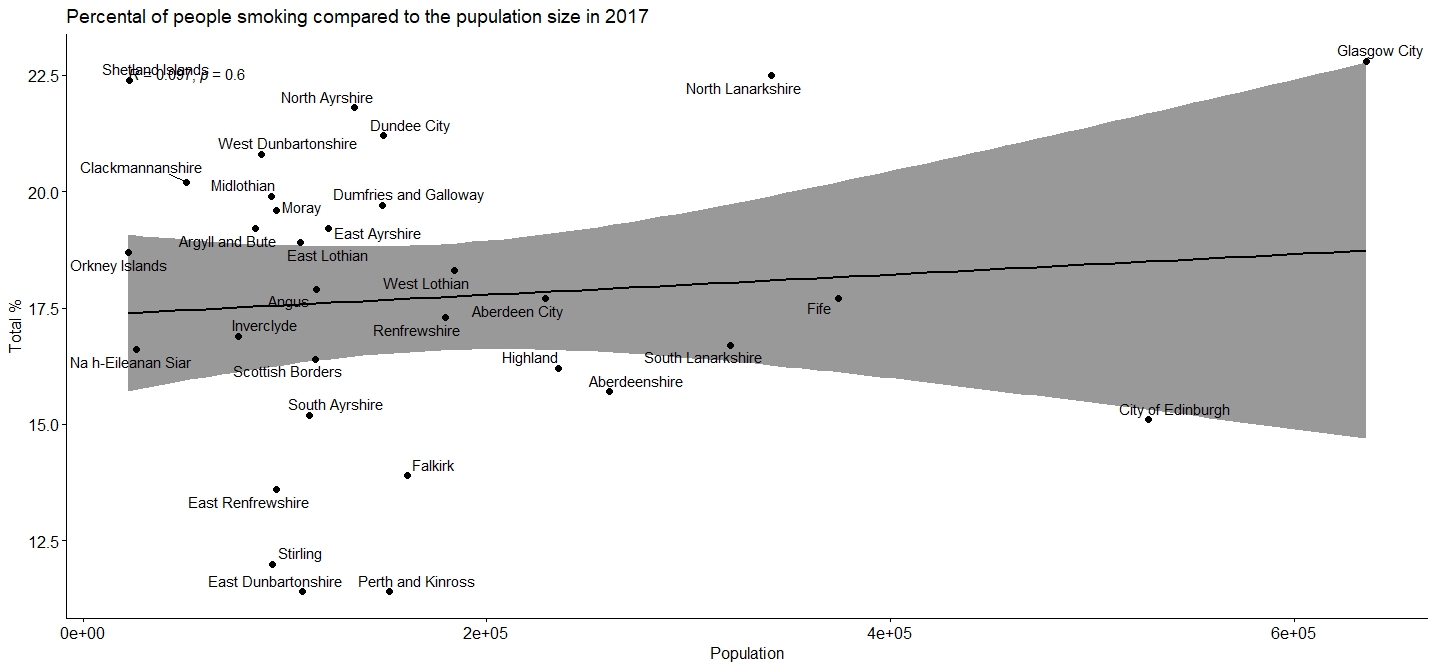
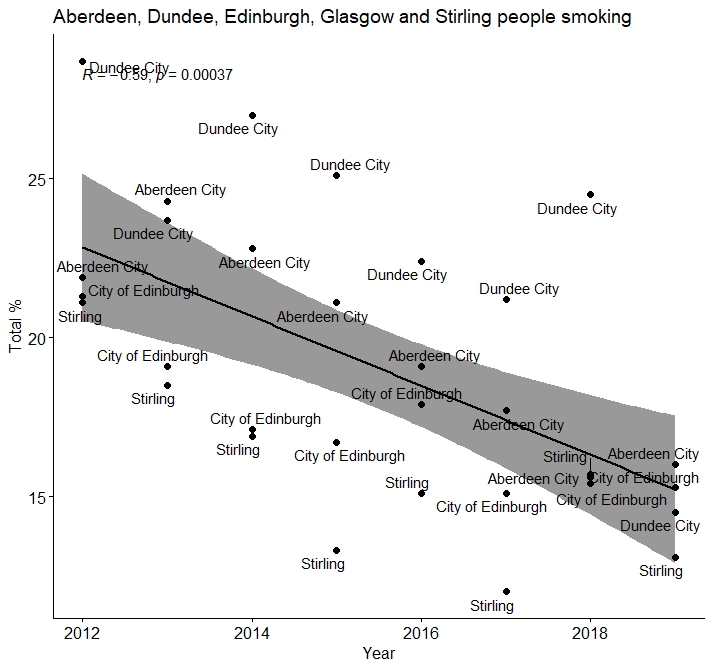
Next, we examine whether larger constituencies smoke more than smaller ones. A Pearson correlation test across constituencies initially suggested no clear relationship:
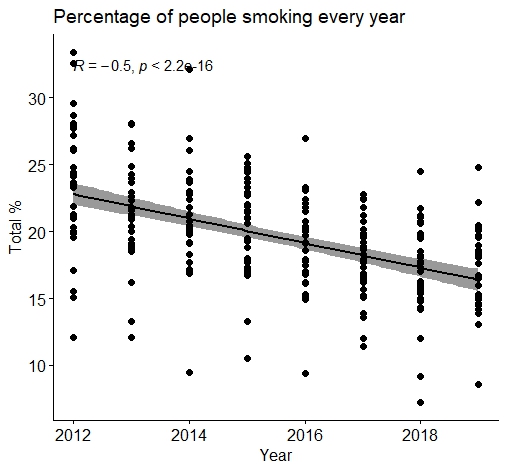
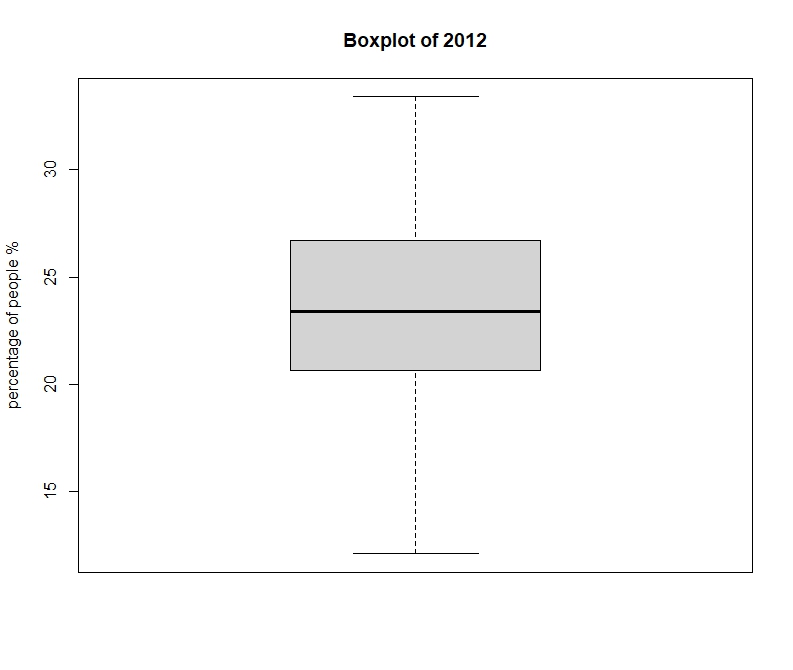
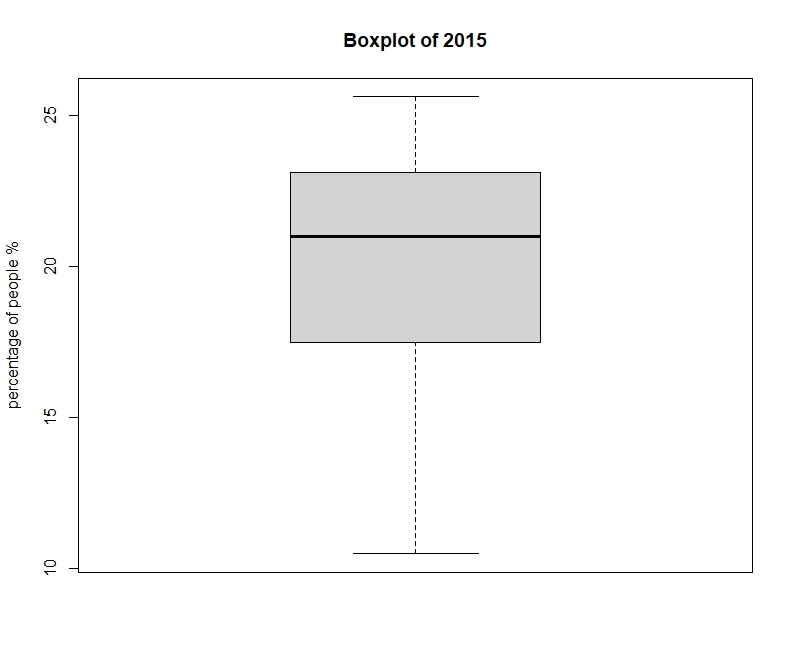
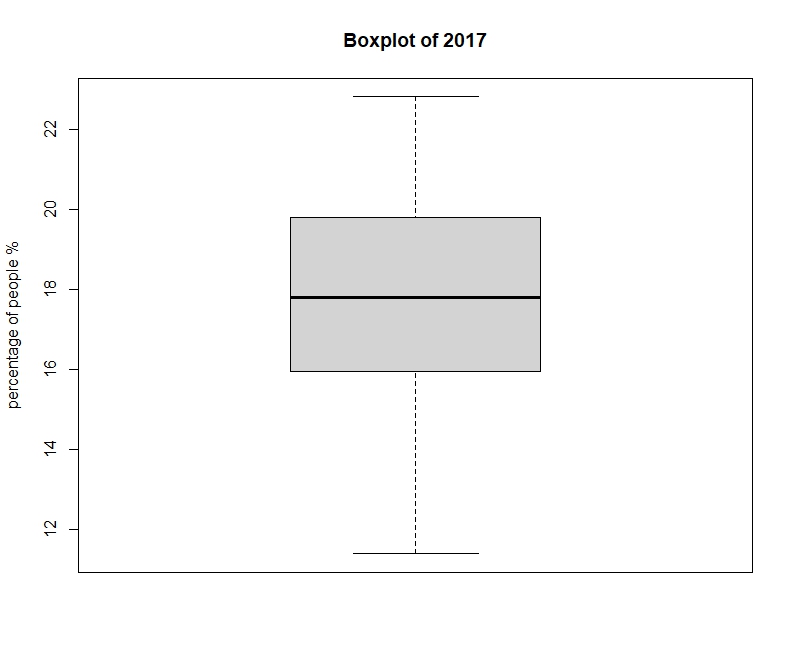
However, plotting data by year for each constituency gives a clearer picture. Boxplots reveal trends as well as outliers in different years.
2012
2013
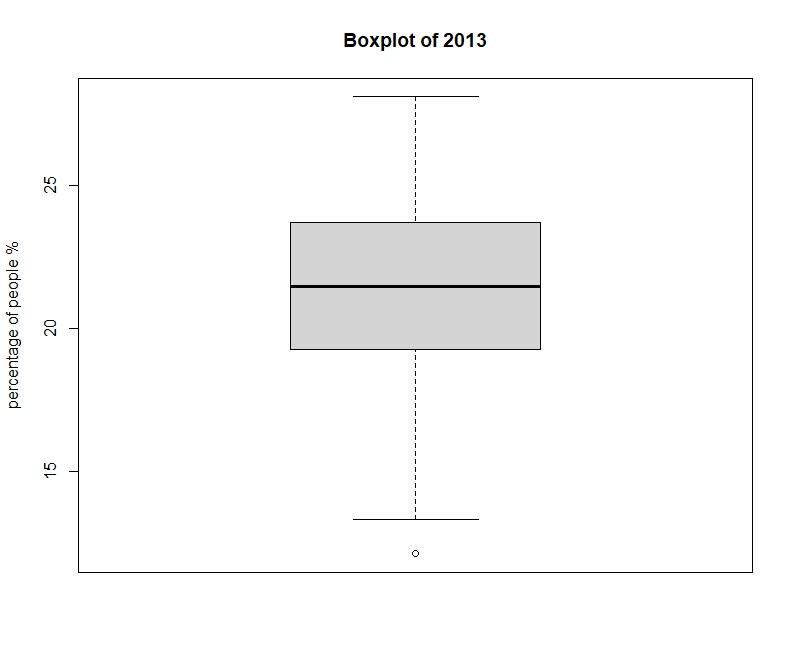
Outlier: East Dunbartonshire
2014
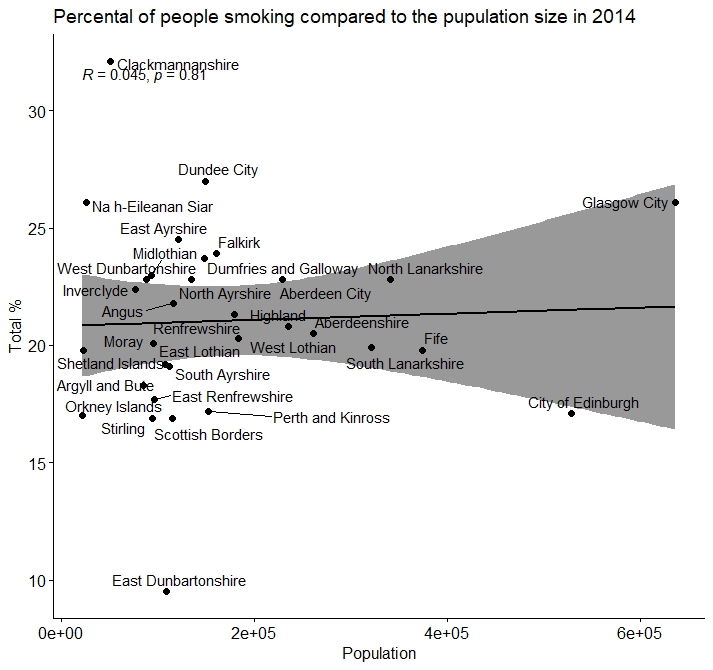
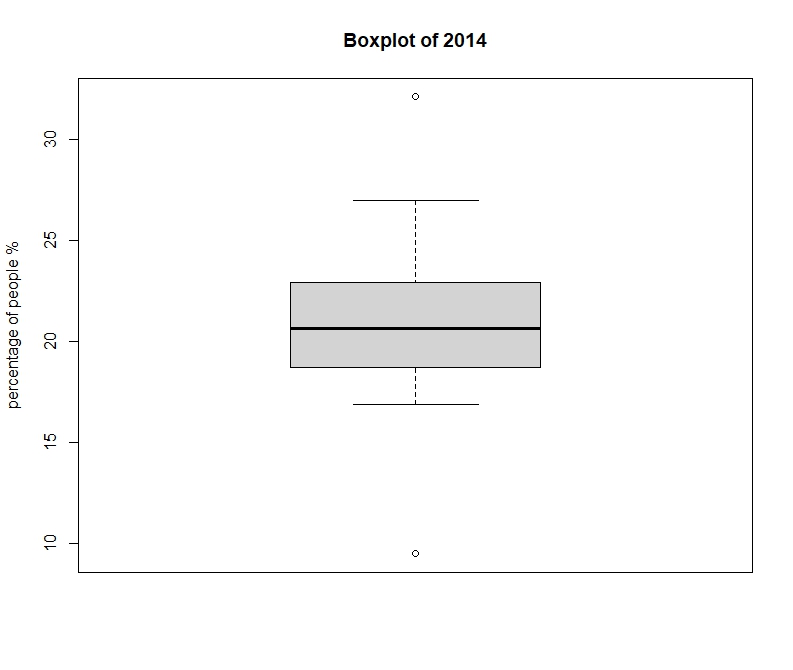
Outliers: Clackmannanshire, East Dunbartonshire
2015
2016


Outlier: East Renfrewshire
2017
2018
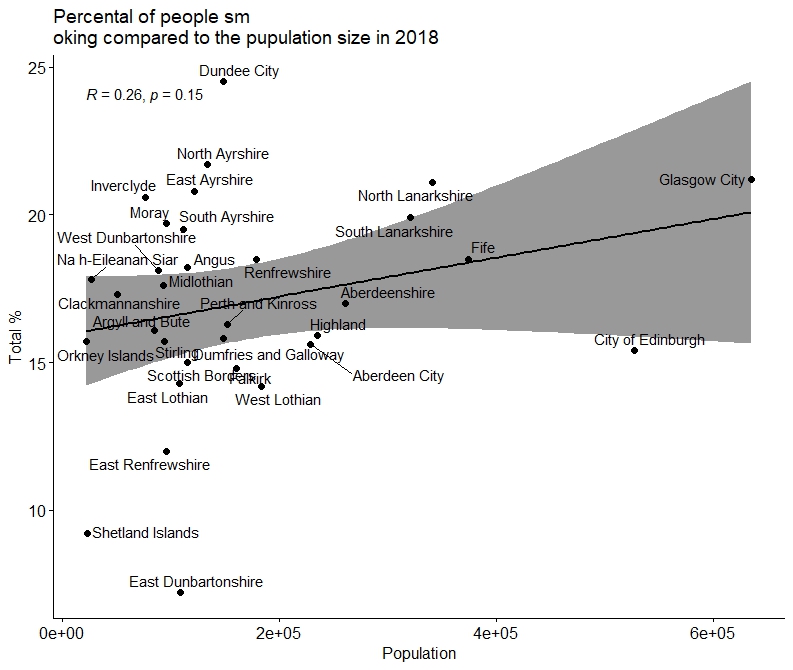

Outliers: Shetland Islands, East Dunbartonshire
2019
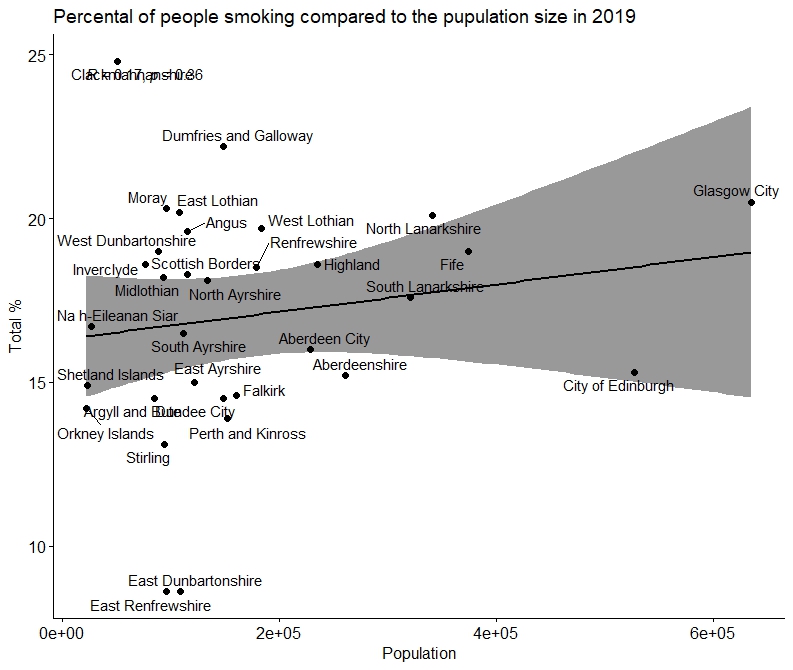

The highest correlation found was in 2014 (81%), but all other years were below 50%—meaning population size was not a reliable predictor of smoking rates. Even large city constituencies showed no consistent relationship.
Data Tables
Below are interactive tables summarizing the dataset for further exploration:
2012–2019 (average)
Yearly Breakdown
Full dataset available here.