How Hot is Scotland? – Fires in the Last Decade
Fire incidents in Scotland have decreased over the past decade. While this is a positive trend, most fires remain ‘Not Accidental,’ particularly in densely populated areas such as Glasgow. This post explores interactive maps, trends, and correlations behind Scotland’s fire statistics.
Over the past decade, the number of fires in Scotland has been falling. This is an encouraging trend, but there is still room for improvement. The majority of incidents were classified as ‘Not Accidental,’ with the highest concentration in densely populated areas such as Glasgow.
Fires over the last decade
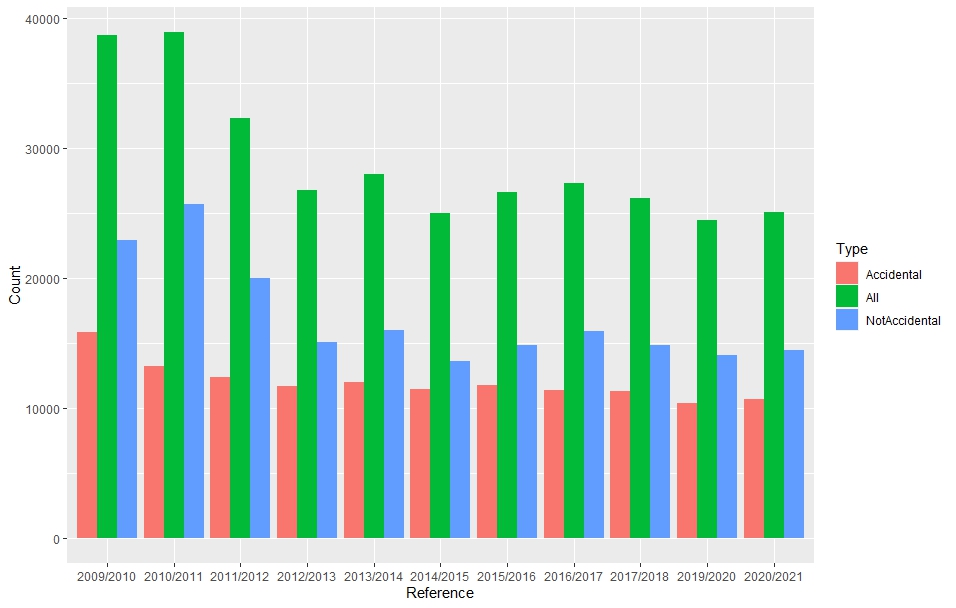
We can see a clear downward trend, particularly after 2010/2011, when the number of incidents began to decline more significantly.
Maps of fire incidents by constituency (2020/2021)
Full-time fire stations are clustered in Aberdeen, Dundee, Edinburgh, and Glasgow. In contrast, large parts of the Highlands and many islands rely on volunteer fire stations, with some islands having no stations at all.
Fires per population
The final map compares the percentage of fires with the percentage of the population for each constituency. However, this measure is not a strong predictor. Correlation analysis shows only weak to moderate relationships between population size and fire incidence:
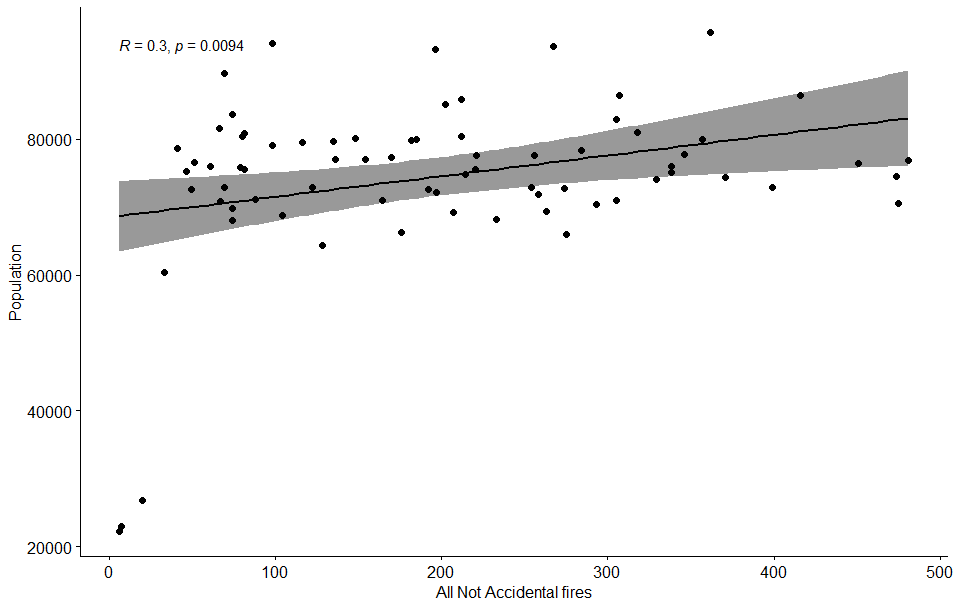
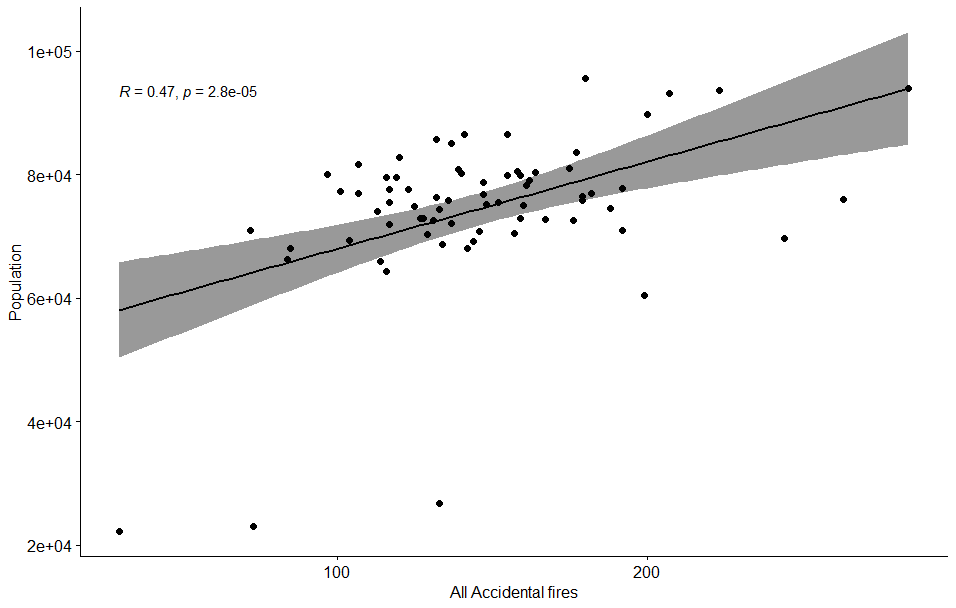
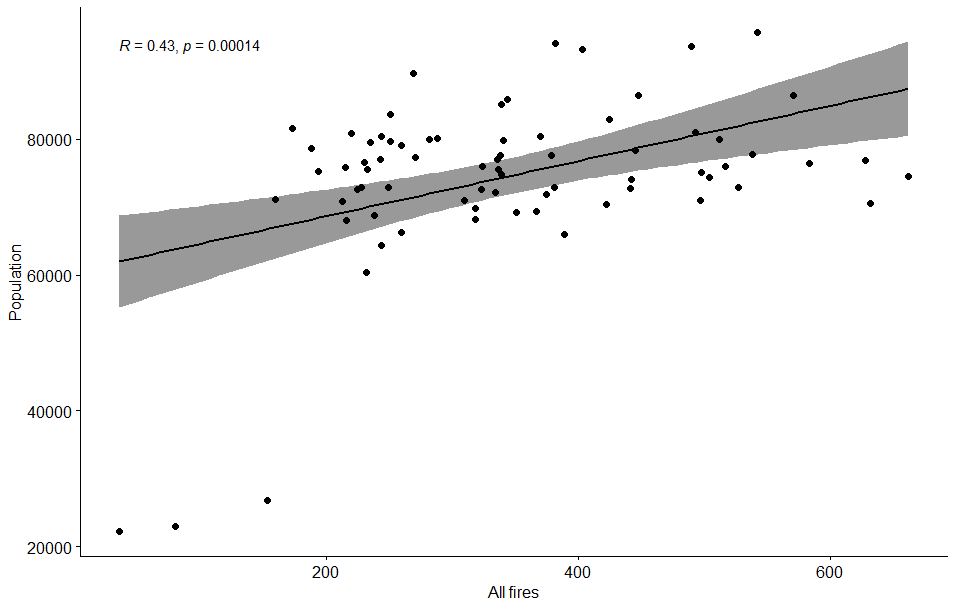
Each point on these graphs represents one Scottish constituency, using the most recent population estimates alongside fire statistics from 2020/2021. Although it is difficult to predict the exact number of incidents, we can calculate averages per year and per day across Scotland and by council area using data from the last five years.
Accidental vs Not Accidental
The government categorises fires into two major groups: Accidental and Not Accidental. Over the past three years, the split has remained relatively stable:
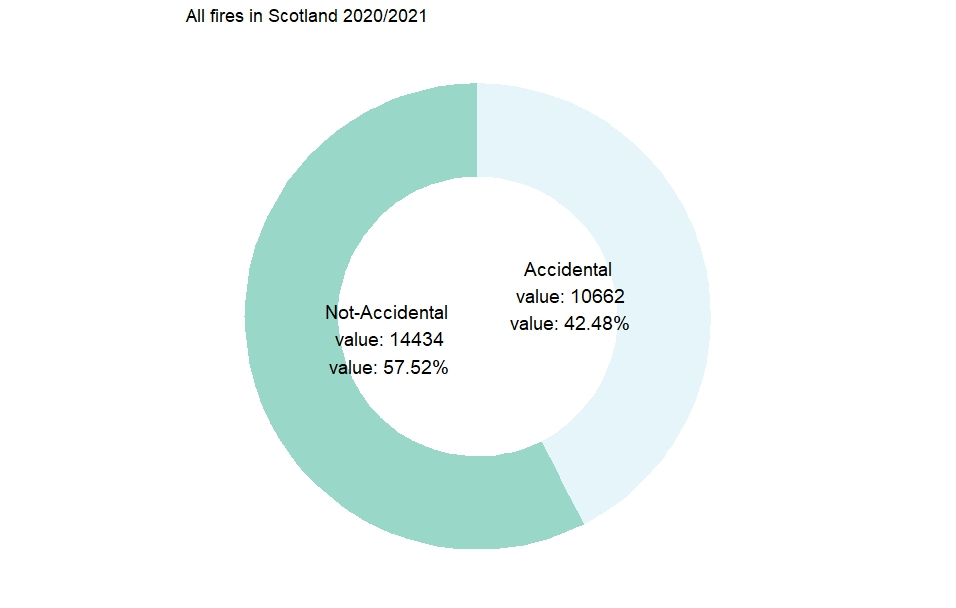
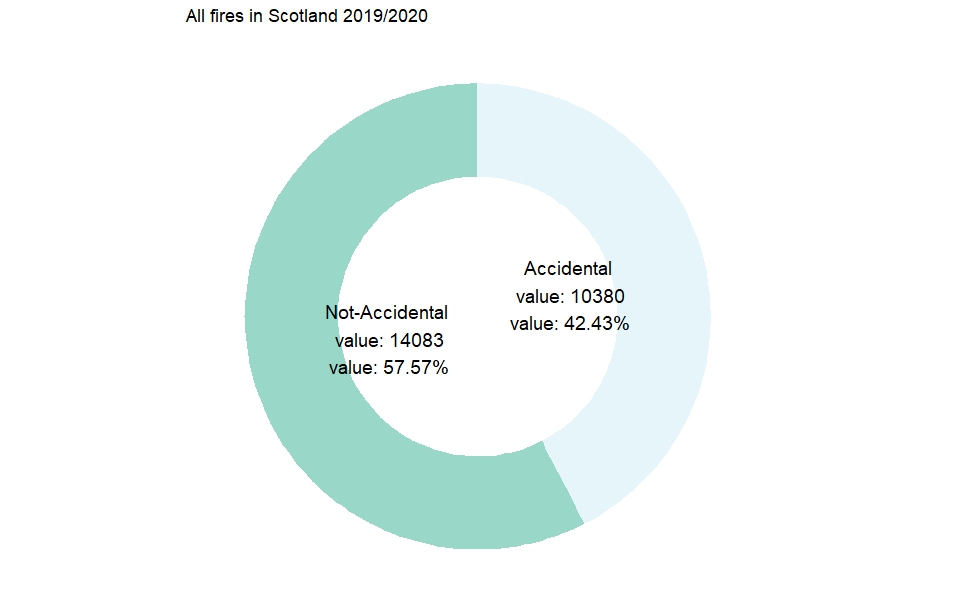
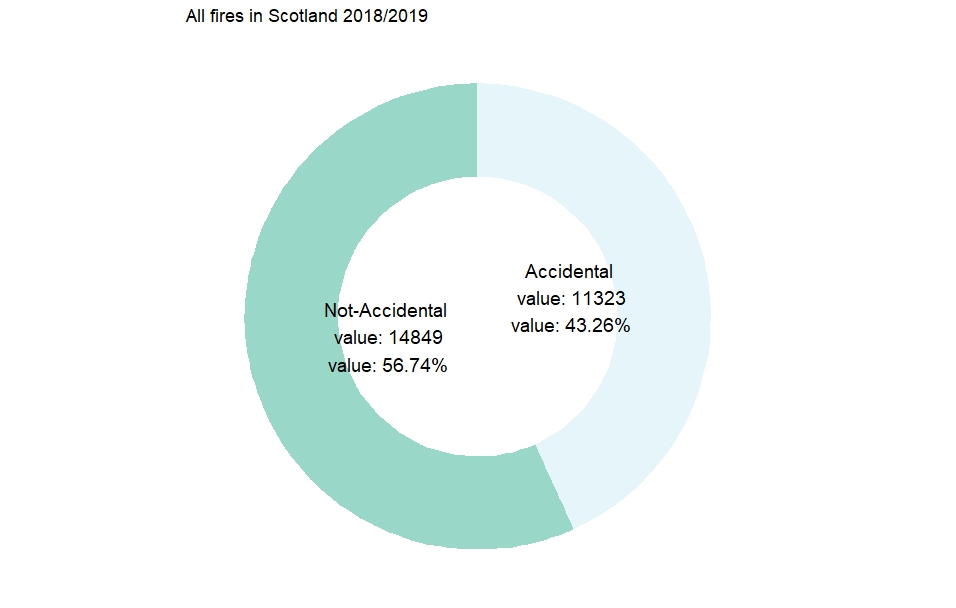
On average, around 42.7% of fires are Accidental and 57.3% are Not Accidental.
---Thank you for reading this first post—it took longer to put together than I’d like to admit, but I hope you found it interesting and informative. If you’d like to use any of the visualisations, please reach out on LinkedIn.
Data source: Scottish Government Fire Statistics